
Exploring
Data Sets
By: Sydney
Roberts
Consider the
following data set:
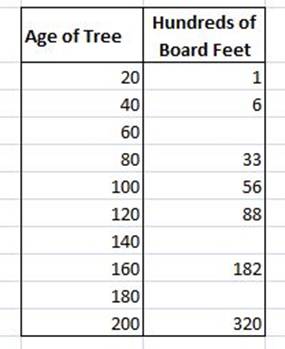
This data is
from the lumber industry, giving the approximate number of board feet of lumber
per tree in a forest of a given age.
In order to
fill in the missing information in the data set, we can use Excel to fit a
function to the data. To get an idea of what shape this function needs, it’s a
good idea to start by creating and looking at a scatterplot
containing the data. This can also be done using Excel.
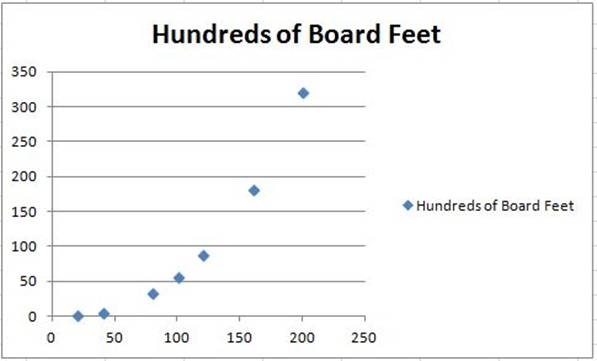
We can tell
that as the age of the tree increases, the number of board feet of lumber also
increases. However, it doesn’t appear that it increases at a linear rate.
Instead, it appears as if it increases exponentially. Because of this
observation, we can use excel to generate an exponential function of the form ![]() .
.
For this data set,
Excel found the best exponential fit to be ![]() with an R2 value of 0.8968.
with an R2 value of 0.8968.
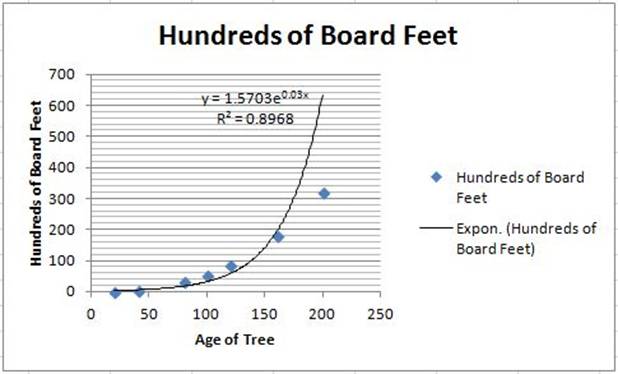
This R2
value gives us the percentage of data that can be explained by the model
function. Therefore, this R2 value tells us that only 89.68% of the
given data can be explained by this exponential function. In retrospect, this
isn’t a very good fit. It appears that the model is increasing faster
than the amount of board feet increases with respect to age. However, we know
we still want to see a function that curves and increases as the age goes
towards infinity.
Therefore,
my next assumption is to try to fit a power function of the form ![]() to the data set. Again we can use
Excel for this and get that the best power function to fit the data is
to the data set. Again we can use
Excel for this and get that the best power function to fit the data is ![]() with an R2 value of 0.9999 which shows
that this is in fact a very good model and accounts for 99.99% of the data.
with an R2 value of 0.9999 which shows
that this is in fact a very good model and accounts for 99.99% of the data.
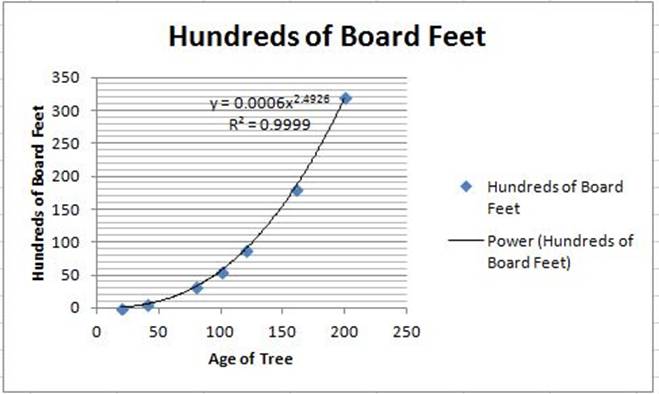
It would be
hard to find a more accurate model than this, so we will consider this the
function that best fits the given data. Now that we have this function, we can
use it to predict our missing values by substituting the age of the tree into
our function for x, and then calculating the y-value. This y-value will be our
predicted hundred of board feet for trees of that age.
For x = 60 à ![]()
For x = 140 à ![]()
For x = 180 à ![]()
For an Excel Document with the data set and function already entered, click HERE